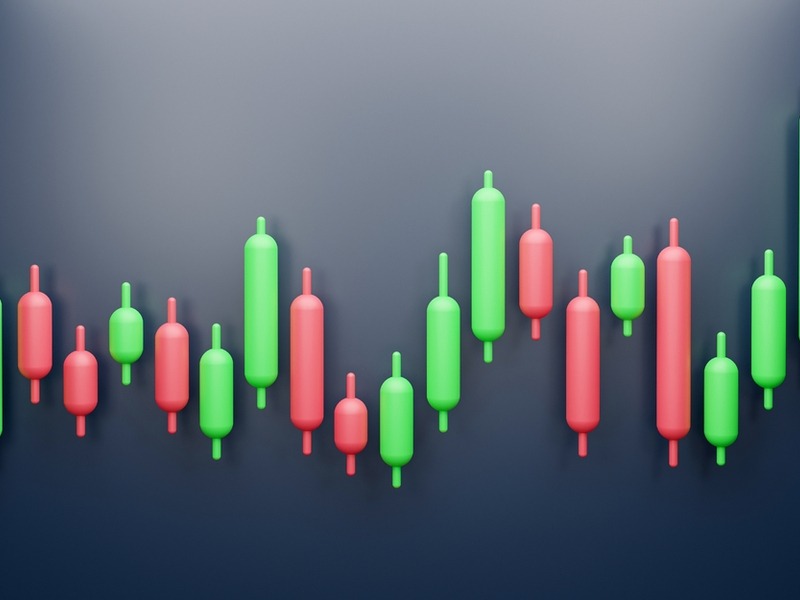
Technical analysis is an essential part of every traders’ analysis of the market as a whole and their target assets. Technical analysis involves the study of charts and the various price trends formed. These trends and chart patterns along with the various candlesticks help the traders understand the current position of their assets as well their potential future direction. The correct interpretation of these tools can result in potentially higher returns and that is what differentiates between an average trader and a good trader. Harami candlesticks are one of the prime tools of analysis in technical analysis.
Given below are the meaning and the related details of harami candlesticks.
What are harami candlesticks?
The word ‘harami’ has its origin in the Japanese language where it means ‘pregnant’. It is a study of multiple candlestick patterns and is used to map the reversal trend. The first candlestick in this pattern is the mother candle with a larger body and the following candle is one with a smaller body representing the child which is embodied by the previous larger candle. These candles together create the visual illusion of a pregnant woman hence the name.
There can be two types of harami candlestick patterns representing a bullish pattern and a bearish pattern.
1. Bullish harami pattern
A bullish harami candlestick pattern is formed when the stock or the asset is in a trend reversal from the existing bearish trend or the downward trend. This pattern indicates that the bulls are in control and the prices of the stock or the asset are on the rise.
2. Bearish harami pattern
A bearish harami candlestick pattern is formed when the stock or the asset is in trend reversal from the existing bullish trend or an upward trend. When this pattern is formed it indicates that the bulls are losing the ground and the bears are taking control. The pressure is on the selling side and the prices of the asset or the stock are on a downward slope.
How to identify harami candlesticks?
The harami candlestick pattern like the inverted hammer candlestick pattern is a visual pattern that can be easily spotted by the traders and analyzed. The ways to identify the bullish harami and the bearish harami candlestick patterns are mentioned below.
1. Bullish harami pattern
A bullish harami candlestick pattern is formed when the mother candle or the larger candle is in red on Day 1 of the trading session. On the following day, the other candle formed is green in colour and may not be more than 25% of the previous day’s candle. The second candle will go mid-way up than the previous day’s candle if the stocks are gaping up. This pattern indicates the reversal of the downtrend to a bullish trend.
2. Bearish harami pattern
A bearish harami candlestick pattern is when the mother candlesticks or the larger candle on day 1 of the trading session is green in colour. On day two of the trading session, a smaller candle is formed that is red in colour and the prices have gapped down. The opening day 2 trading session of the stock or the asset is with a price that is lower than the previous day’s closing and the entire body of the day 2 candle is within the range of the previous day’s green candle. This indicates the takeover of the bearish sentiment in the market and the reversal of the bullish trend to a bearish one.
How to trade using harami candlesticks?
Harami candlestick pattern is the visual pattern where the traders have to wait for two or more trading sessions for the pattern to form. Once a definitive bullish harami or a bearish harami pattern is formed, the traders can take their trading positions based on the pattern that is formed.
1. Trading in case of a bullish harami pattern
When the bullish harami pattern is formed, the traders should ideally wait for the third candle to form to confirm the trend. If the third candle is green or bullish the trend reversal is confirmed. Traders can enter the market or take buy positions in such cases when the prices are preferably on the gap up and cross the highest point of the first day’s candle. It is important to always use stop loss while trading in harami patterns so the traders can limit their exposure if the pattern does not stand the market pressure and breaks.
2. Trading in case of a bearish harami pattern
Similar to the bullish harami pattern, in the case of a bearish harami pattern too, the traders should wait for the third day’s candle to confirm the trend reversal. If the third days’; candle is red it confirms the trend reversal. Traders can enter the market and take suitable short positions when the prices are preferably on the gap down and cross the lowest point of the first day’s candle. In this case too, traders should always use stop loss while trading in harami patterns so they can limit their exposure if the pattern does not stand the market pressure and cracks.
An important indicator of this trend reversal pattern is the volume that is traded. When the trend pattern is backed by the volume that is traded it further asserts the formation of the pattern.
Conclusion
The Harami candlestick pattern is one of the many visual patterns that can be used by traders to understand the price movements of their target stocks or the market as a whole. It is important to note that the harami candle is itself a price action component. Hence, traders should include the price action strategy in their analysis of the market.
FAQs
Few advantages of the harami candlestick pattern are,
-It is a visual pattern so it is simple to spot and recognize.
-It does not involve the use of complex formulas and calculations to form and understand. Hence, it can be used by new traders as well as experienced ones.
-It can be used across different types of assets like stocks, indices, forex or crypto.
The disadvantages of the harami candlestick pattern include that it needs due confirmation before its execution. It is a visual pattern but traders should also rely on other technical indicators that support the trend reversal before applying it.
No. Traders need to observe the candles formed on two consecutive trading sessions for this pattern to form and wait for this candle for its confirmation. Also, it is crucial to analyse the previous trend and the price action for its successful execution.
Traders can use price action or indicators like Bollinger bands to trade based on the harami candlestick patterns.